IPO market hits decade high
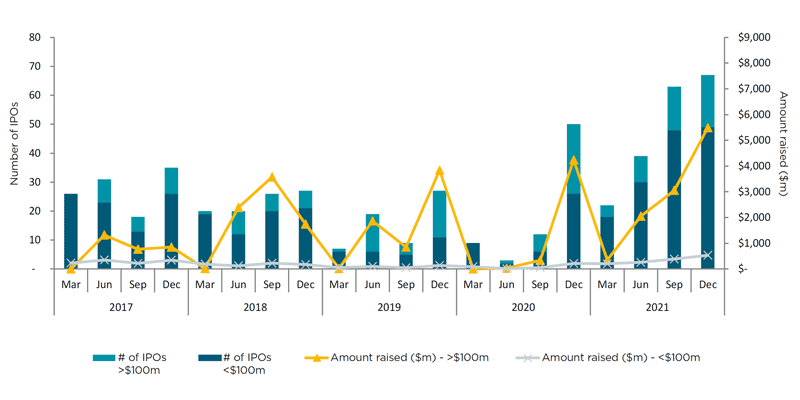
2021 was an exceptionally strong year for initial public offerings (IPOs) with the market recording the highest number of new floats in a decade, and more than the previous two years combined.
IPO Watch Australia Report Summary
- 191 new listings on the ASX in 2021
- Total funds raised for the year was $12.33 billion – more than double the funds raised in 2020
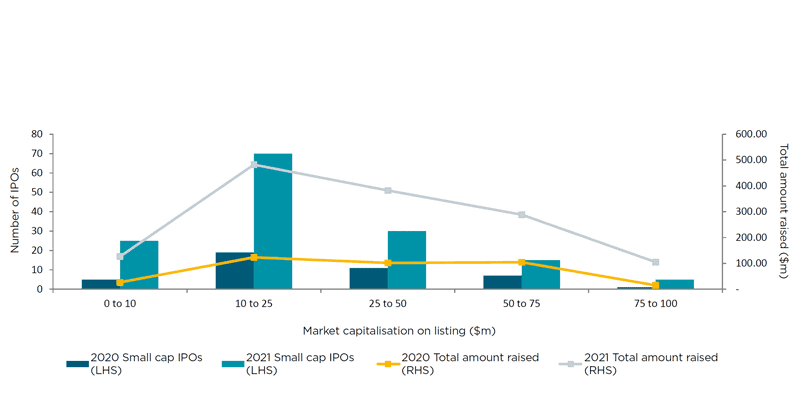
- 145 small cap listings (market capitalisation less than $100 million), representing 56 per cent of new market entrants
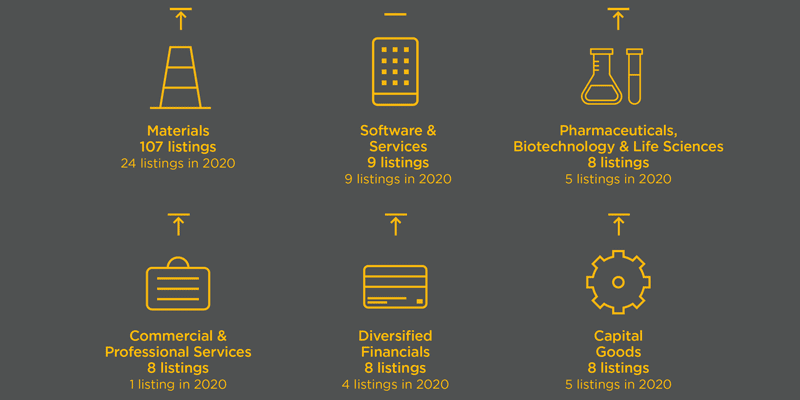
- 21 different industry sectors recorded listings in 2021, with Materials companies contributing 32 per cent of all listings
- 87 per cent of IPOs met or exceeded their capital raising goals, an increase on the five-year average of 83 per cent
- A healthy outlook for the Australian market in 2022, particularly for resources.
About IPO Watch Australia
First published in 2004, IPO Watch Australia is a benchmarking-based report. The research, led by HLB Mann Judd Perth, analyses Australian listing activity over the previous 12-month period. The report is authored by Corporate & Audit Services Partner, Marcus Ohm. The report commentary articulates key data points and explores themes arising from market activity. This year's analysis includes:
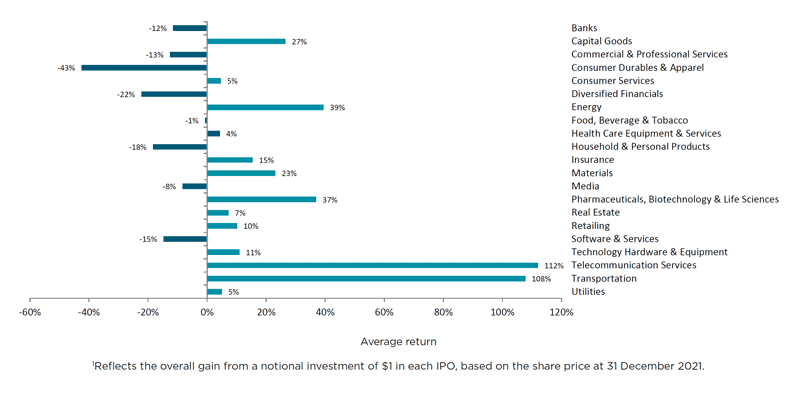
- Share price performance;
- Sector analysis;
- IPO subscription rates;
- Review of activity by quarter;
- Resources sector performance; and
- Market outlook for 2022.
In addition to the commentary, we speak to East 33 (ASX: E33), a leading producer and supplier of Sydney rock oysters, which successfully listed on the ASX in July last year. We also take a closer look at VC activity in the Australian market and its role in shaping the business landscape as well as the ESG agenda and its importance in developing a successful growth strategy.
How HLB can help
We offer a comprehensive range of professional services to listed clients and companies considering IPO, including:
- Investigating accountant's reports on historical and forecast information;
- Independent expert's reports;
- Analysis and advice on feasibility and alternatives to an IPO;
- Corporate and structuring advice;
- Financial and taxation due diligence; and
- Company shareholder tax advice and planning.
Learn more about our corporate advisory expertise.


