IPO market hits decade high
2021 was an exceptionally strong year for initial public offerings (IPOs) with the market recording the highest number of new floats in a decade, and more than the previous two years combined.
IPO Watch Australia Report Summary
- 191 new listings on the ASX in 2021
- Total funds raised for the year was $12.33 billion – more than double the funds raised in 2020
- 145 small cap listings (market capitalisation less than $100 million), representing 56 per cent of new market entrants
- 21 different industry sectors recorded listings in 2021, with Materials companies contributing 32 per cent of all listings
- 87 per cent of IPOs met or exceeded their capital raising goals, an increase on the five-year average of 83 per cent
- A healthy outlook for the Australian market in 2022, particularly for resources.
About IPO Watch Australia
First published in 2004, IPO Watch Australia is a benchmarking-based report. The research, led by HLB Mann Judd Perth, analyses Australian listing activity over the previous 12-month period. The report is authored by Corporate & Audit Services Partner, Marcus Ohm. The report commentary articulates key data points and explores themes arising from market activity. This year's analysis includes:
- Share price performance;
- Sector analysis;
- IPO subscription rates;
- Review of activity by quarter;
- Resources sector performance; and
- Market outlook for 2022.
In addition to the commentary, we speak to East 33 (ASX: E33), a leading producer and supplier of Sydney rock oysters, which successfully listed on the ASX in July last year. We also take a closer look at VC activity in the Australian market and its role in shaping the business landscape as well as the ESG agenda and its importance in developing a successful growth strategy.
How HLB can help
We offer a comprehensive range of professional services to listed clients and companies considering IPO, including:
- Investigating accountant's reports on historical and forecast information;
- Independent expert's reports;
- Analysis and advice on feasibility and alternatives to an IPO;
- Corporate and structuring advice;
- Financial and taxation due diligence; and
- Company shareholder tax advice and planning.
Learn more about our corporate advisory expertise.
Key findings
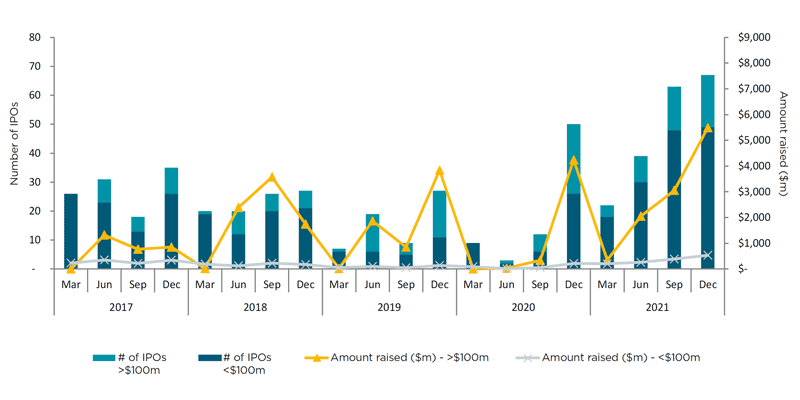
Strong volumes throughout the year
Following the strong end to 2020, listing activity continued to grow throughout 2021, particularly during the second half of the year. This trend looks set to continue into early 2022 based upon upcoming floats.
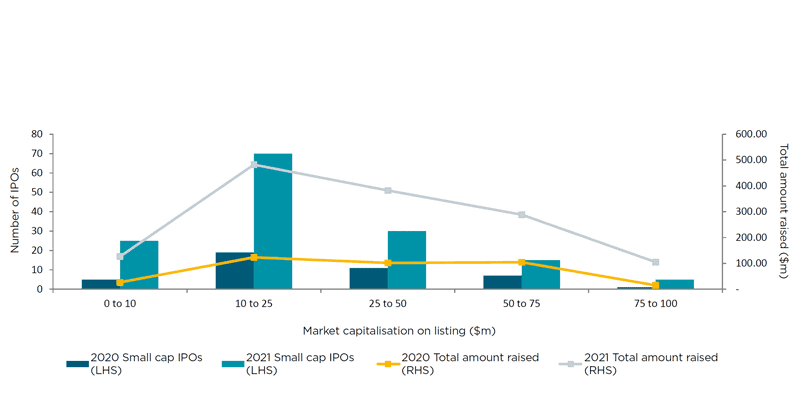
Significant growth in small cap listings
There was a total of 145 new small cap (market capitalisation of less than $100 million) listings in 2021, compared to 43 in the prior year. Small cap companies made up 76% of all new listings in the current year and 11.2% of total funds raised. The increased number of listings was most apparent within the $10-$25 million bracket.
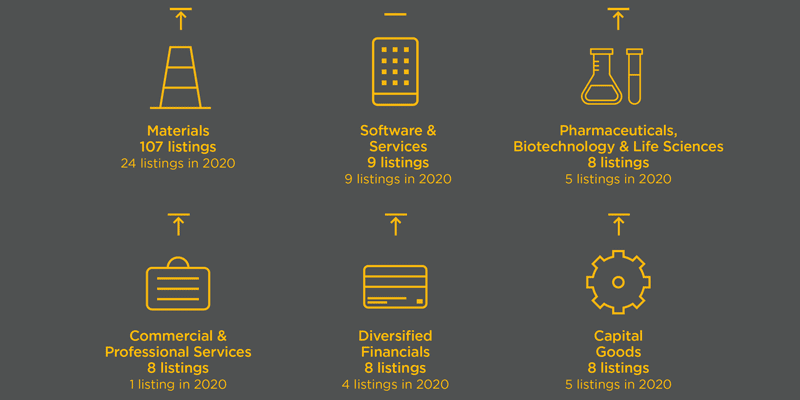
Materials sector dominant
The year was dominated by listings from the Materials sector which contributed 107 new listings or 56% of all floats, 99 of which were small cap listings. Despite this concentration of Materials listings, there were other sectors which had good activity levels in comparison to previous years. A total of 13 segments had three or more listings during the year.
There were 21 different industry sectors represented during 2021 compared to 15 sectors in 2020.
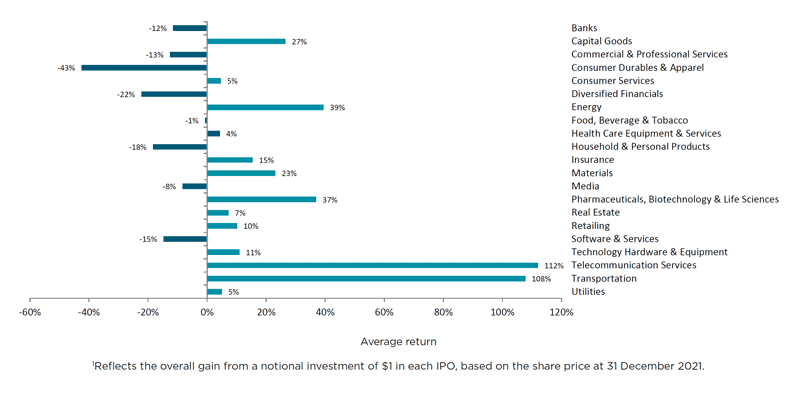
Positive performance overall
Whilst the overall performance was positive, there was significant outperformance and underperformance from certain entities. A total of 86 of the 191 listings for the year recorded a year end gain over listing price. On average, companies recorded a 17% share price gain over their issue price by the end of the year, with 22 listings recording a gain of 100% or greater for the year.